Cavity Resonance
The purpose of this experiment is to explore the resonant behavior of an acoustic cavity (a coke bottle). Recall that a resonant frequency is defined as a natural frequency of vibration which is determined by the physical properties of the vibrating object. In this case the physical properties which affect the natural frequency of the cavity are its volume, area of opening, and length of opening port. In this experiment, only the effects of changing volume will be explored since the other factors are not easily changed.
The apparatus consists of a coke bottle, a graduated cylinder, and a digital computer interface with which to produce a digital image of the sound made by blowing over the coke bottle.
Procedure: Setup of Computer Interface:
- Connect the Sound Sensor to port A, Analog Inputs, Pasco 850
将声音传感器连接到端口A,模拟输入,Pasco 850
- Open the Capstone software on the laptop.
在笔记本电脑上打开Capstone软件
- From the column of displays on the right, drag Scope onto the display area.
从右侧显示列中拖动Scope到显示区域。
- From "Hardware Setup" on left, choose Pasco 850.
从左侧的'硬件设置'中选择Pasco 850。
- Click on Analog Input A and choose Sound Sensor (s on keyboard will take you to it). Click the "Hardware Setup" button again to clear that window.
点击模拟输入A,选择声音传感器(键盘上的按键会带你找到它)。再次点击“硬件设置”按钮以清除该窗口。
- For the horizontal axis choose Time, and for the vertical axis Sound Intensity, Channel A.
对于横轴选择时间,纵轴选择声音强度,通道A。
- Set Sound Sensor to 2.5 kHz as a reasonable initial value - then you can experiment with other settings if you choose.
将声音传感器设置为2.5 kHz作为合理的初始值——然后你可以根据需要尝试其他设置。
- Produce sound, click Record, then click again to stop recording.
制作声音,点击录音,然后再次点击停止录音。
- Position the mouse over the Time label to get a set of horizontal arrows that you can drag to spread out the sound display until you get a clear display of at least 10 periods. A reasonable starting point is about 0.1 seconds full width of the window. For the vertical or voltage scale, +/- 2 volts is a reasonable starting range.
将鼠标移到时间标签上,会出现一组水平箭头,您可以拖动这些箭头以展开声音显示,直到清晰地显示至少10个周期。一个合理的选择是窗口的全宽约为0.1秒。对于垂直或电压刻度,±2伏特是一个合理的选择。
- Use the Coordinate tool to measure a start time for one of the wave peaks, then move 10 periods and measure the time, then divide by 10 to get the period in seconds. Calculate the frequency. You can just click on the Coordinate tool to place a measurement box on the screen. If you wish, you can leave the initial measurement in place and click on the Coordinate tool again to place a second measurement box at the end of 10 periods.
使用坐标工具测量一个波峰的起始时间,然后移动10个周期并测量时间,将该时间除以10得到以秒为单位的周期。计算频率。你可以只需点击坐标工具在屏幕上放置一个测量框。如果你想,可以保留初始测量位置,再次点击坐标工具在10个周期结束处放置第二个测量框。
Comments on Data Collection:
- To produce a cleaner sound waveform, place the sensor just behind the coke bottle, and just low enough so that you are not blowing directly on the sensor.
为产生更清晰的声波波形,将传感器放在煤瓶后方,位置要低一些,以免直接对着传感器吹气。
- Experiment with the vertical sensitivity and the horizontal time axis to get a clearly defined sinusoidal pattern.
用垂直灵敏度和水平时间轴获得一个清晰定义的正弦波模式。
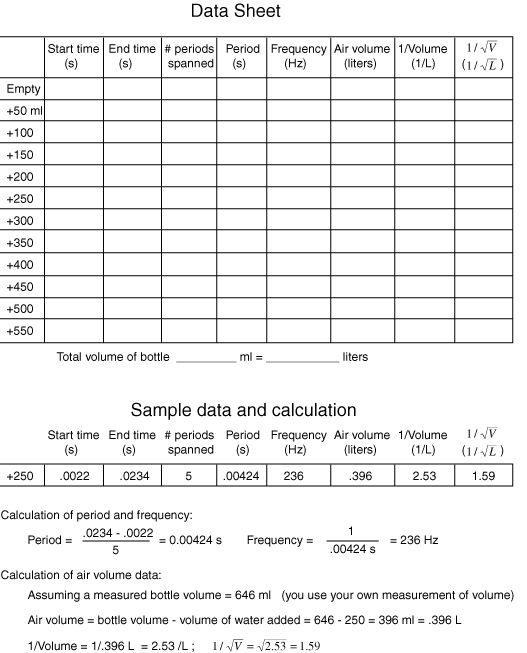
- Repeat the process after adding 50 ml (same as cm3) of water from a graduated cylinder. Continue adding water in 50 ml amounts and taking data until you have filled the coke bottle. Fill the bottle completely and determine the total volume of air so that you can work backwards to get the volume of air for each of your measurements.
再加入50毫升(相当于立方厘米)的水,从量筒中取水。继续以50毫升的量添加水并记录数据,直到装满可乐瓶。将瓶子完全装满,并确定总空气体积,以便可以倒推得到每次测量的空气体积。
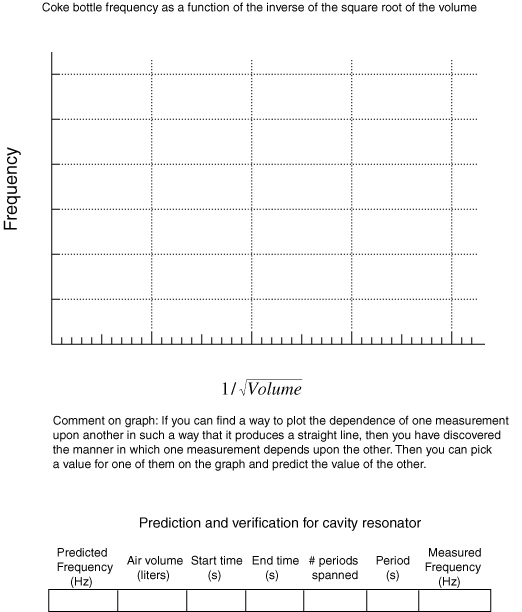
- Plot your data with frequency in Hz on the vertical axis and your column of values for one divided by the square root of volume on the horizontal axis.
将频率(单位为Hz)作为纵轴,你的一列值(即1除以体积平方根)作为横轴来绘制数据。
Prediction-verification:
- Determine the value on the horizontal axis of your graph which corresponds to the frequency of middle-C (262 Hz). Calculate the corresponding air volume and add enough water to produce that air volume.
确定你图表中水平轴上对应中音C(262 Hz)频率的值。计算相应的空气体积,并加入足够的水以产生该空气体积。数据采集评论:
- Take data as in step 10 above to determine the frequency of the cavity.
采用上述第10步中的数据确定谐振腔的频率。