Confidence Intervals
置信区间
The Poisson distribution provides a useful way to assess the percentage of time when a given range of results will be expected. You might wish to project a reasonable upper limit on some event after making a number of observations.
泊松分布提供了一种评估在给定结果范围内的百分比时间的有用方法。在进行若干次观察后,你可能希望对某些事件设定一个合理的上限。
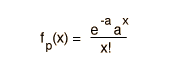
For example, if you have measured a certain type of special event only once (x=1) during your run at a large accelerator after observing n events, then you might wish to project how many events you would have to observe to have a 90% confidence level of seeing at least one additional such special event. (This would help defend your request for more time on the accelerator next time!) This kind of projection is well suited to Poisson statistics. A convenient approach to the calculation is to calculate the mean value "a" of the observation for which the observation of value x=0 is 10% probable. In terms of the Poisson distribution, this condition can be expressed as
例如,如果你在大型加速器运行中只观察到某类特殊事件一次(x=1),那么你可能希望预测需要观察多少事件才能以90%的置信水平看到至少另一个这样的特殊事件。(这将有助于你下次申请更多时间在加速器上!)这种预测非常适合泊松统计。一种方便的计算方法是计算观测值的平均值“a”,使得观测值x=0的概率为10%。用泊松分布来表示,这一条件可以表达为

Now since the mean is a = n'p and the probability p=1/n where n is the number of your previous observations, it follows that to achieve a 90% confidence level of seeing another special event, you would have to observe n' = 2.3n more events. That is, you must observe 2.3 times as many as you did the first time in order to be 90% sure of seeing another one.
现在由于平均值是 a = n'p,而概率 p=1/n,其中 n 是你之前观察的事件数目,因此要达到90%的置信度看到另一个特殊事件,你必须观察 n' = 2.3n 个事件。也就是说,你必须观察的事件数目是第一次的2.3倍,才能有90%的把握看到另一个事件。
Another way of interpreting this result is that if you observe n events without seeing any of the desired special events, then with 90% confidence you can say that the mean value for observation of such events is less than 2.3 = a where a=np is the standard mean value. Based on a small number of observations of events which are presumed to act by pure probability, you can make a projection of the upper bound for such events at a chosen level of confidence.
另一种解释这种结果的方式是,如果你观察到n个事件而没有发现任何特异事件,那么在90%的置信水平下,可以认为这类事件的平均观测值小于2.3 = a,其中a=np是标准平均值。基于少量的事件观测,这些事件被认为是由纯粹的概率作用引起的,你可以在选定的置信水平下对这类事件的上限进行预测。
Number of
observed events
观测事件数量 | Projected upper
limit a at 90%
90%置信度下的上限 | Projected upper
limit a at 95%
95%置信度下的上限 |
0 | 2.30 | 3.00 |
1 | 3.89 | 4.74 |
2 | 5.32 | 6.30 |
3 | 6.68 | 7.75 |
4 | 7.99 | 9.15 |
5 | 9.27 | 10.51 |
| The upper limit of observation a at a confidence level 90% and 95% is shown in the table for values of x up to 5. The values for x=0 can be calculated directly. Those for x=1 and above require setting the sum of the probabilities for x observations = (100% - confidence level), and they are trancendental equations which must be solved numerically. The values in the table are from Rohlf, Chapter 2.
在90%和95%的置信水平下,观测值a的上限如表中所示,对于x不超过5的值。x=0的值可以直接计算得出。而x=1及以上的值则需要将x次观测的概率之和设为(100% - 置信水平),这些是超越方程,必须通过数值方法求解。表中的值来自Rohlf,第二章。 |
|