Log Plot for Power Relationships
功率关系的对数图
For linear relationships, the point-slope form of a line can give useful information about the relationships. For variables for which the relationship is some kind of power law, a plot of the logarithms of the variables can help extract information about the power relationship. The case of a freely falling object will be used to illustrate such a plot.
对于线性关系,直线的点斜式可以提供关于关系的有用信息。对于变量之间存在某种幂律关系的情况,对变量的对数进行绘图可以帮助提取关于幂律关系的信息。自由下落物体的例子将用于说明这种绘图。
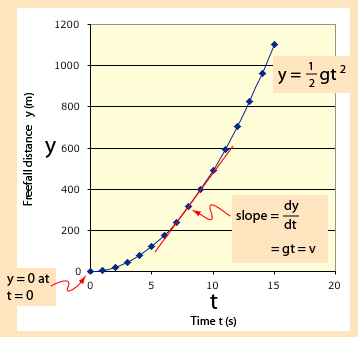 | The linear plot is useful for showing the quadratic relationship between distance and time, and the slope of the curve is a measure of the derivative of the distance with respect to time which is the instantaneous velocity.
线性图有助于显示距离与时间之间的二次关系,曲线的斜率是距离对时间的导数的度量,即瞬时速度。 |
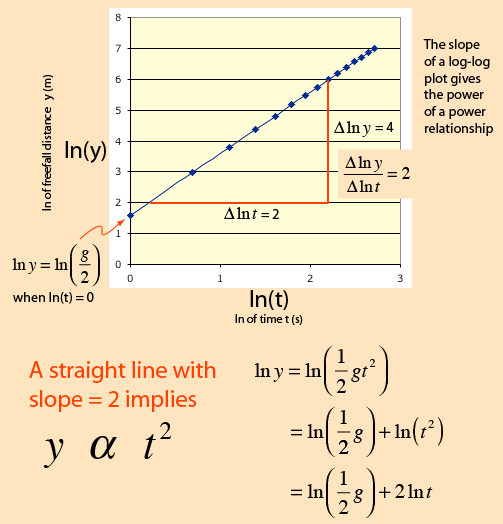
A plot of the logarithm of the freefall distance as a function of the logarithm of time yields a straight line of slope 2. The slope of a log-log plot gives the power of the relationship, and a straight line is an indication that a definite power relationship exists.
将自由下落距离的对数作为时间对数函数的图线绘制出来,得到一条斜率为2的直线。log-log图的斜率表示关系的幂次,而直线表明存在确定的幂次关系。
| Applications
应用 | Mass-luminosity relationship for stars
恒星的质-光关系 |
索引
| HyperPhysics*****HyperMath*****Geometry
HyperPhysics ***** HyperMath ***** 几何 | R Nave |
返回