Snow Cover
积雪覆盖
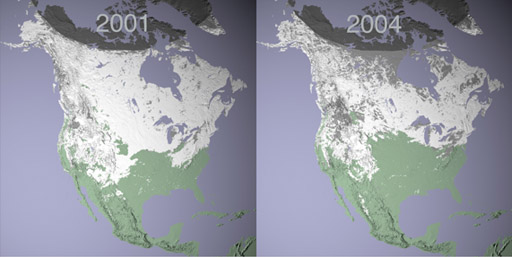
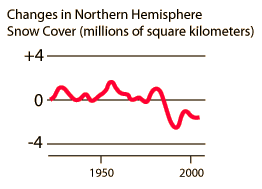 | The graph of snow-cover area is sketched from data in Collins, et al. The images of snow-cover above are NASA images from http://earthobservatory.nasa.gov . They were derived using data from the Moderate Resolution Imaging Spectroradiometer (MODIS), flying aboard NASA's Terra satellite. The two maps represent maximum snow cover in North America during the same 8-day period in 2001 and 2004. . 雪覆盖面积的图是根据Collins等人提供的数据绘制的。上方的雪覆盖图像来自http://earthobservatory.nasa.gov,由NASA的Terra卫星上的中分辨率成像光谱辐射计(MODIS)数据衍生而来。两张地图表示2001年和2004年同一8天期间北美最大雪覆盖面积。 |
| Recent global temperatures
近期全球温度 |
References
Collins, et al.
索引参考Collins等
| HyperPhysics***** Thermodynamics
HyperPhysics ***** 热力学 | R Nave |
返回