Estimation of Reverberation Time
The reverberation time of an auditorium or a room is usually defined as the time required to drop 60 decibels below the initial level. The decay of a sharp sound like a hand clap or a finger snap will produce a reverberant decay in the room which can be approximated by an exponential curve. This reverberant decay can be observed by using a microphone with the laboratory interfaces, and measurements of voltage from the microphone at different times can be used to estimate the reverberation time of the room.
Procedure: Calculation of reverberation time from Sabine Formula:
Measure the length, width and height of the laboratory room. Typical absorption coefficients for the walls, floor and ceiling will be provided. Use the Sabine Formula calculation to calculate a reverberation time for the room.
| Reverberation Time calculation
混响时间计算 |
Calculated room Reverberation Time _________
Setup of Computer Interface:
1. Double-click on the DataStudio icon to start the data collection software.
2. Scroll down the "Sensors" menu to "Sound Sensor" [the ear icon on the menu] and click-and-drag that icon to the image of the port where your microphone is connected.
Data Collection:
1. Click on "Scope" under the "Displays" menu to display an oscilloscope screen. Click the "Start" button and produce a sound to confirm that you can display a sound waveform.
2. You will need to experiment with producing a sharp sound and getting a display of it on the scope. Try a hand clap at a half to one meter away from the microphone, or a finger snap if you like that better. It may take some experimentation to get a display. You will need to slow down the horizontal motion of the sweep by clicking on the horizontal scaling display, which may read something like 5ms when you start. Once you are producing a satisfactory display, then click the "Stop" button when one sound burst is displayed before it erases it for the next sweep.
3. Click the data storage button to store that trace of the sound waveform. This button looks like pincers picking up a ball. Then double-click on "Graph" under the "Displays" menu to put a graph on the screen. Drag the icon for your data set over onto the graph to display it. It will appear cluttered with their cute symbols for data points, but you can clean it up by going to the Display/Settings and taking off the "Show data points" , "Show Legend Symbol", and "Show Legend" options.
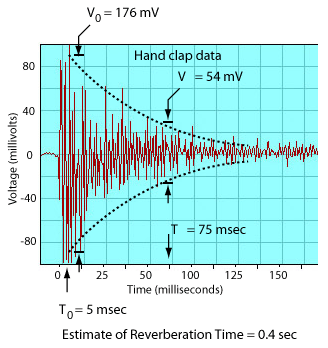
4. The sound decay will generally not be a neat decay - it will be a jagged set of peaks which diminish with time. You will have to visualize a smooth decay curve and estimate the height of that curve at some point in time. It is also more convenient to visualize a symmetric decay above and below the center line and just measure the full width as shown in the illustration below. Measure the initial height of the burst to record as V0 and record the initial time T0. Then pick a convenient time along the horizontal scale and make your best estimate of the height of the decay pattern at that time T to record as voltage V. Since there is considerable uncertainty, try to get 5 different points. If it is not reasonable to sample at five different points on one display, then do another handclap to collect additional sets. Then take the link to the calculation routine and calculate the reverberation time associated with each set of voltage and time data. Average the results of the calculations to get your final estimate of the reverberation time of the room.
| Trial
试验 | interval 时间间隔 | Reverberation Time 计算得到的混响时间 | ||||
| _______ | _______ | ______________ | _______ | |||
| _______ | _______ | ______________ | _______ | |||
| _______ | _______ | ______________ | _______ | |||
| _______ | _______ | ______________ | _______ | |||
| _______ | _______ | ______________ | _______ | |||
平均混响时间 | ||||||
| Calculation of Reverberation Time
混响时间的计算 |