Bilingual edition: English is preserved and Chinese follows each unit. Terminology uses the confirmed v20260916 glossary; automated semantic review remains traceable.
中英双语版:英文原文完整保留,中文紧随对应单元;术语采用 v20260916 确认表,自动语义审校结果可追溯。

Pure Tone Audiometry

纯音听力测试

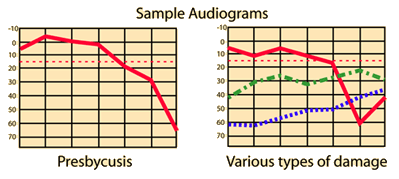
The testing of hearing is most often carried out by establishing the threshold of hearing, the softest sound which can be perceived in a controlled environment. It is typical to do this testing with pure tones by providing calibrated tones to a person via earphones, allowing that person to increase the level until it can just be heard. Various strategies are used, but pure tone audiometry with tones starting at about 125 Hz and increasing by octaves, half-octaves, or third-octaves to about 8000 Hz is typical. Hearing tests of right and left ears are generally done independently. The results of such tests are summarized in audiograms.

听力测试通常是在受控环境中确定听阈,即最轻微可被感知的声音。通常采用纯音进行测试,通过耳机向被试者提供校准的音调,允许被试者逐渐提高音量直到刚刚能听到。各种策略被采用,但通常使用从约125 Hz开始,以八度、半八度或三分之八度递增到约8000 Hz的纯音进行听力测试。右耳和左耳的听力测试通常分别进行。此类测试的结果通常以听力图(audiogram)形式总结。
Audiograms compare hearing to the normal threshold of hearing, which varies with frequency as illustrated by the hearing curves. The audiogram is normalized to the hearing curve so that a straight horizontal line at 0 represents normal hearing.
听力图将听力与正常听力阈值进行比较,如听力曲线所示,该阈值随频率而变化。听力图被归一化到听力曲线,因此一条水平线在0处表示正常听力。
Click on illustration for further details.
点击示意图以获取更多细节。
Hearing loss
听力损失
Index

Hearing concepts

Dangers of Loud Sounds
索引 声学概念 噪音的危险
 
HyperPhysics***** Sound
HyperPhysics ***** 声音
R Nave
Go Back
返回


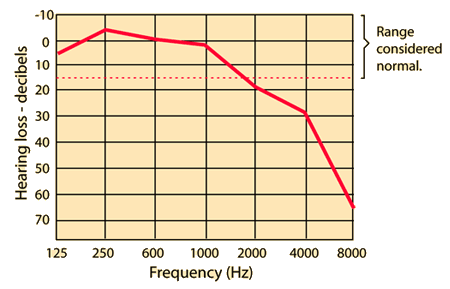
Audiogram Showing Presbycusis

显示老年性耳聋的听力图

The progressive loss of high frequency sensitivity with aging is typical, and is called presbycusis. The loss of the high frequencies can make it difficult to understand speech, since the intelligible differences in speech sounds are often in the range above 2000 Hz.

随着年龄增长,高频灵敏度的逐渐丧失是典型的,这种现象称为老年性耳聋。高频的丧失会使理解言语变得困难,因为言语中可辨识的差异往往位于2000赫兹以上的范围。
When hearing aids are used, it is important to amplify the high frequencies, since it is uncommon for there to be significant loss at low frequencies. Audiograms are important for the prescribing of hearing aids.
使用助听器时,应重点放大高频声音,因为低频段通常不会有显著的损失。听力图对于助听器的处方具有重要意义。

Speak up! Quit mumbling!

说清楚!别含糊其辞!

Older persons may have difficulty understanding speech clearly because of progressive loss of high frequency hearing.

年长者可能因高频听力逐渐丧失而难以清晰理解言语。
Index

Hearing concepts

References
Nave & Nave
Ch. 18

Backus
Ch. 5
索引 声学概念 参考文献 Nave & Nave 第18章 Backus 第5章
 
HyperPhysics***** Sound
HyperPhysics ***** 声音
R Nave
Go Back
返回


Audiograms Showing Hearing Loss

听力损失的听力图

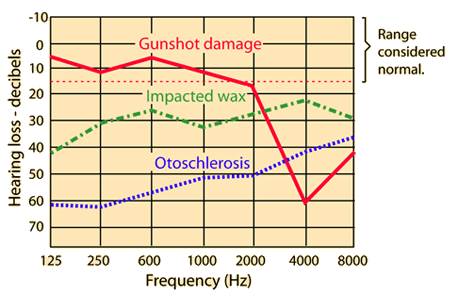
Audiograms can help with the diagnosis of various types of hearing disorders. Specific geometries of curves are found to be typical of presbycusis, and a characteristic notch in the hearing curve may be the signature of damage by a sudden loud sound like a gunshot or a firecracker explosion close to the ear.

听力图有助于诊断各种类型的听力障碍。特定曲线的几何形状被发现是老年性耳聋的典型特征,而听力曲线中的一个特征性凹陷可能是由近距离的剧烈声响,如枪声或鞭炮爆炸造成的损伤所致。
The curves are normalized so that a straight horizontal line represents equal loudness.
这些曲线已归一化,使得一条水平直线表示等响度。
Index

Hearing concepts

References
Nave & Nave
Ch. 18

Backus
Ch. 5
索引 声学概念 参考文献 Nave & Nave 第18章 Backus 第5章
 
HyperPhysics***** Sound
HyperPhysics ***** 声音
R Nave
Go Back
返回