Example of Information from Equal Loudness Curves
等响曲线上的信息示例
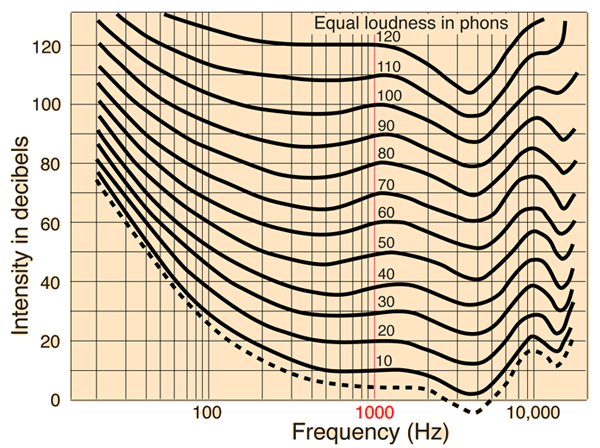
Three example curves from the equal loudness curves are shown below, corresponding to very soft, midrange and very loud sounds.
以下所示的三条等响曲线对应非常安静、中等强度和非常响亮的声音。
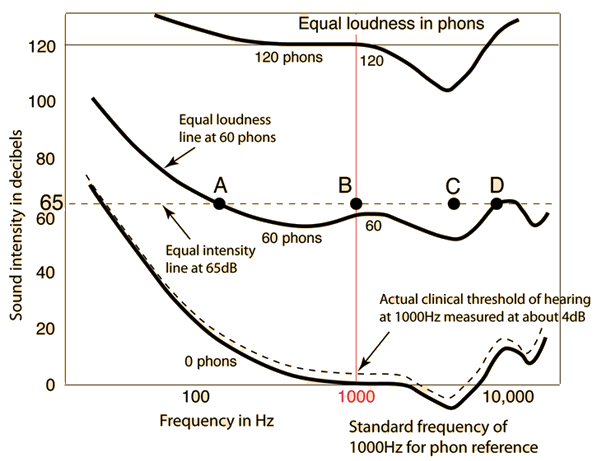
Examination of these three curves makes it evident that there is considerable difference between the ear's response at different sound levels. The response to very loud sounds is much "flatter" or more uniform than the response to very soft sounds, although it still shows the prominent enhancement of sensitivity between about 2000-5000Hz associated with the ear canal resonance. Where the curve dips between 2000-5000Hz, this implies that less sound intensity is necessary for the ear to perceive the same loudness as a 120dB, 1000Hz tone. In contrast, the strong rise in the curve for 0 phons at low frequencies shows that the ear has a notable discrimination against low frequencies for very soft sounds.
对这三个曲线的考察表明,人耳在不同声音强度下的响应存在显著差异。对于非常响亮的声音,其响应要“更平坦”或更均匀,相较于非常安静的声音,尽管它仍然显示出在约2000-5000Hz范围内与耳道共振相关的灵敏度显著增强。当曲线在2000-5000Hz范围内下降时,这意味着对于人耳来说,要感知与120分贝、1000Hz声音相同的响度,所需的声强要小得多。相反,对于0phon的低频段,曲线显著上升,表明人耳对于非常安静的声音在低频段有显著的辨别能力。
Since the vertical axis is in decibels, the flat horizontal line at 65dB represents an equal intensity at all frequencies. The example sounds A, B, C and D all have the same sound intensity of 65dB. However, this does not imply that they have the same loudness to the human ear. We can say that sounds A and D have the same loudness since both are on the same equal loudness curve. This curve passes through 60dB at 1000Hz, so we characterize all sounds on that equal loudness curve, including sounds A and D, as having a loudness of 60 phons. Sound B is above the 60 phon curve, so that implies that it would be perceived as louder than A or D. In fact, since sound B is at 1000Hz and has an intensity of 65 dB, we can say that its loudness is 65 phons. The perceived loudness at 1000 Hz is the reference point for defining the equal loudness curve through that point, so the numerical value of phons and dB is always the same at 1000 Hz. Finally, we could say that sound C at 65dB is the loudest of the four sounds since it shows the greatest displacement above the 60 phon curve. From this graph, we cannot determine what that phon level is; that would require experimental comparison with 1000 Hz tones.
由于垂直轴以分贝为单位,65dB的水平直线表示所有频率都有相同的强度。示例声音A、B、C和D的强度均为65dB。然而,这并不意味着它们对人耳来说有相同的响度。我们可以认为声音A和D的响度相同,因为它们位于同一条等响曲线之上。这条曲线在1000Hz时为60dB,因此我们可以将所有位于该等响曲线上的声音,包括声音A和D,描述为具有60phon的响度。声音B位于60phon曲线之上,因此意味着它会被感知为比A或D更响。事实上,由于声音B在1000Hz时强度为65dB,我们可以说它的响度为65phon。在1000Hz处的响度是定义通过该点的等响曲线的参考点,因此在1000Hz时,phon和dB的数值总是相同的。最后,我们可以认为声音C在65dB时是四个声音中最响的,因为它在60phon曲线上方的位移最大。从这张图中,我们无法确定该phon水平的具体值;这需要与1000Hz的纯音进行实验比较。 |
Index
Loudness concepts
Hearing concepts
索引 响度概念 听觉概念 |