Harmonic Content Demonstration
To illustrate the fact that harmonic content is the major contributer to sound timbre for sustained sounds, the Science of Sound demonstration package produced by Bell Telephone Laboratories in the 1960s contained recordings of a factory whistle, a soprano and a piano that had been carefully adjusted to the same pitch and intensity. It was then demonstrated that if all of the harmonics were filtered out, the tones were almost indistinguishable.
Displays of all three full sounds are shown below. The first display for each sound shows the amplitude as a function of time, and the second is the discrete Fourier transform, showing the amplitude of the fundamental and the first few harmonics. These displays were created with Macscope2 by Elisha Huggins.


The following illustrations group just the amplitude vs time displays for the three sounds. While the differences are evident, it is difficult to characterize them in detail.
The illustrations below show the comparisons of the harmonic amplitudes. This kind of display is called a discrete Fourier transform. This is a much more definitive way to measure the differences between the sounds.
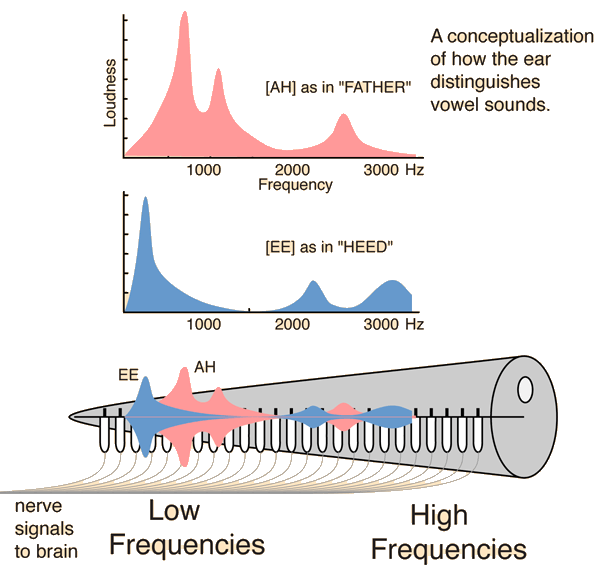
The illustrations below show qualitative differences between vowel sounds when the amplitude vs frequency is plotted. This kind of plot is a Fourier transform of the variation of amplitude vs time and can be correlated with how the human ear acts as a sound analyzer.
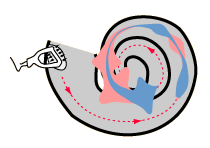 |
To explain how the ear can recognize different vowel sounds, the idea of vocal formants is invoked. This is a conceptualization only; no scaling to the inner ear was done. The place theory suggests that the ear distinguishes pitches based on the location of maximum excitation along the basilar membrane of the inner ear. So the ear acts as a sound analyzer which can detect differences in harmonic content by the different amounts of excitation at different places along the basilar membrane. Since sustained vowel sounds differ primarily in their harmonic content, this offers a mechanism by which the ear can distinguish them. 为了说明耳朵如何区分不同的元音声音,引入了‘共鸣峰’的概念。这是一种概念性的解释;并未对内耳进行任何缩放。位置理论认为,耳朵通过内耳基底膜上最大激发位置来区分音高。因此,耳朵像一个声音分析器,能够通过基底膜上不同位置的激发量差异来检测谐波成分的差异。由于持续的元音声音主要差异在于其谐波成分,这为耳朵区分这些声音提供了一种机制。
|
| Geometric waves
几何波 |
Loudness concepts
Hearing concepts
| HyperPhysics***** Sound
HyperPhysics ***** 声音 | R Nave |