Spectral Power Distribution光谱功率分布
Light may be precisely characterized by giving the power of the light at each wavelength in the visible spectrum. The resulting spectral power distribution (SPD) contains all the basic physical data about the light and serves as the starting point for quantitative analyses of color. The SPD can be measured by a spectrophotometer. From the SPD both the luminance and the chromaticity of a color may be derived to precisely describe the color in the CIE system. Other systems of color measurement can also be related to the SPD. These systems have been successful in predicting color perception from the SPD, but it is not possible to proceed in the opposite direction. That is, the SPD cannot be predicted from the characteristics of the color as perceived by the human eye. 光可以精确地通过在可见光谱中每个波长处给出的光的功率来描述。所得到的光谱功率分布(SPD)包含了关于光的所有基本物理数据,并作为对颜色进行定量分析的起点。SPD可以通过分光光度计测量。从SPD可以推导出颜色的光亮度和色度,从而在CIE系统中精确地描述颜色。其他颜色测量系统也可以与SPD相关联。这些系统在从SPD预测颜色感知方面取得了成功,但无法反向进行。也就是说,无法从人眼感知的颜色特性来预测SPD。
The SPD of light from an illuminated surface is the product of the percent reflectance of the surface and the SPD of the light which falls on the surface. 照射在物体表面的光的光谱分布是该表面的反射率与照射到该表面的光的光谱分布的乘积。
|
Index Vision concepts Color vision Color measurement Reference Williamson & Cummins 索引视觉概念颜色视觉颜色测量参考Williamson & Cummins | |||
|
Go Back
返回 |
Example of Spectral Power Distribution Application谱功率分布应用示例
You may buy an item of clothing under interior lighting and find that its color appears differently in outdoor light. The selection of makeup color may also be influenced by the interior light under which it is viewed. These effects may be quantified in terms of the spectral power distribution of the light under the different circumstances. The illustrations below depict the SPD curves for different interior fluorescent lighting. 你可能在室内照明下购买一件衣物,发现其颜色在户外照明下看起来不同。所选的化妆品颜色也可能受到其观看时所处的室内照明的影响。这些效应可以以不同情况下的光源光谱功率分布来量化。下图展示了不同室内荧光灯的SPD曲线。
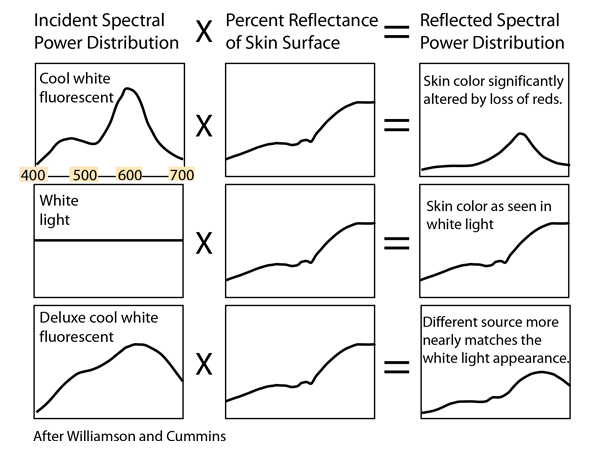
![]() Williamson and Cummins cite General Electric Company Publication TP119, "Light and Color" for the data on the fluorescent lights. Williamson 和 Cummins 引用通用电气公司出版物 TP119,《光与颜色》中有关荧光灯的数据。
|
Index Vision concepts Color vision Color measurement Reference Williamson & Cummins Ch 2 索引 视觉概念 色觉 色度测量 参考 Williamson & Cummins 第2章 | ||
|
Go Back
返回 |
Example of Spectral Power Distribution Application谱功率分布应用示例
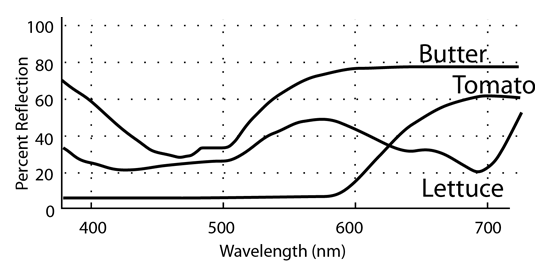
An example of the spectral power distribution of light from common objects shows that such colors arise from a range of wavelengths. Even the vivid red of a tomato involves a range of wavelengths in the red region of the visible spectrum. 光的光谱功率分布示例显示,这些颜色是由一系列波长组成的。即使番茄鲜艳的红色也涉及可见光谱中红区域的一系列波长。
![]() After Williamson and Cummins, who cite General Electric Company Publication TP119, "Light and Color" for the data. 在Williamson和Cummins之后,他们引用了通用电气公司出版物TP119《光与颜色》中的数据。
|
Index Vision concepts Color vision Color measurement Reference Williamson & Cummins Ch 2 索引 视觉概念 色觉 色度测量 参考 Williamson & Cummins 第2章 | ||
|
Go Back
返回 |