|
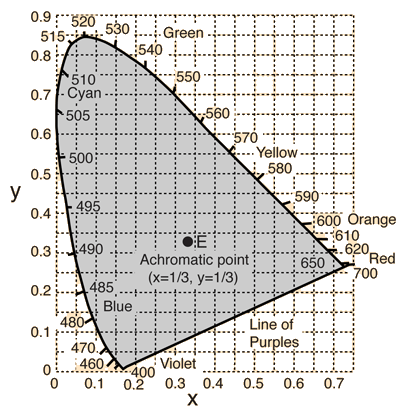
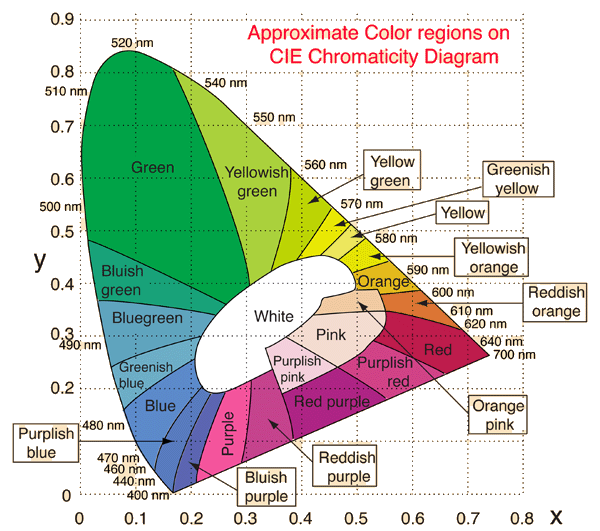
Approximate colors can be assigned to areas on the CIE Chromaticity Diagram. These are rough categories, and not to be taken as precise statements of color. The boundaries and the color names are adapted from Brand Fortner, "Number by Color", Part 5, SciTech Journal 6, p32, May/June 1996.
CIE色度图上的区域可以大致分配颜色。这些是粗略的分类,不应视为对颜色的精确描述。边界和颜色名称参考了Brand Fortner的《Number by Color》第五部分,SciTech期刊第6期,第32页,1996年5/6月。
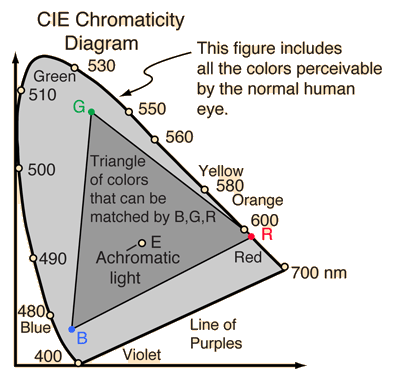
Any attempt to depict the gamut of human color vision on a computer monitor must be accompanied by numerous qualifications and exceptions. In the first place, you cannot display the range of human color perception on an RGB monitor - the gamut of normal human vision covers the entire CIE diagram while the gamut of an RGB monitor can be displayed as a triangular region within the CIE diagram. Another qualification is that the hue and saturation associated with a given color name can vary over a considerable range. Add to that the variations with different kinds of display monitors, and you rightly conclude that an accurate rendition is impossible. With all those excuses, however, it still might be instructive to provide a rough idea of the regions of the CIE Diagram associated with common color names.
任何试图在计算机显示器上描绘人类全部色觉范围都必须伴随着众多的限定和例外。首先,你无法在RGB显示器上显示人类正常色觉的全部范围——人类正常色觉覆盖了整个CIE图,而RGB显示器的色域则可以显示为CIE图内的一个三角形区域。另一个限定是,与给定颜色名称相关的色相和饱和度可以在相当大的范围内变化。再加上不同种类显示器的差异,你完全可以得出准确再现是不可能的结论。然而,尽管有这些理由,仍然可能有帮助地提供一些关于CIE图中与常见颜色名称相关的区域的粗略概念。
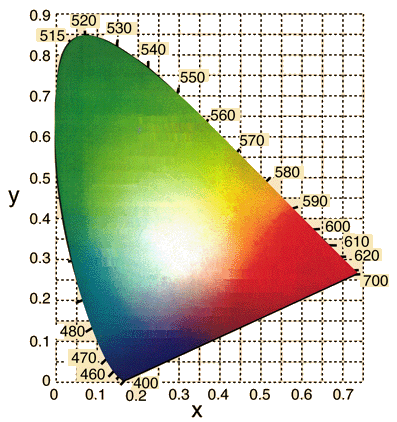
The display here was created by choosing representative RGB values for the color regions from a rendition of the 1976 CIE Chromaticity Diagram provided by Photo Research, Inc. Note that one representative value in about the middle of the hue and saturation ranges was chosen for each section of the diagram. The point chosen was just a visual judgment of a representative color in the range. The RGB values obtained are listed in the table at right. A different observer would likely have chosen different points to represent the color names, but at least these values might provide a starting point for preferred variations.
此处的显示是通过从Photo Research, Inc.提供的1976年CIE色度图中选取代表性的RGB值来创建的。请注意,对于图中的每个部分,都选择了 hue 和 saturation 范围中间的某一点作为代表。所选的点只是一个对范围内代表性颜色的视觉判断。获得的RGB值列在右侧的表格中。不同的观察者可能会选择不同的点来代表颜色名称,但至少这些值可以作为首选变体的起点。
One characteristic of the commonly used 1931 CIE Chromaticity Diagram that is evident even from this crude portrayal is that the green takes up far too much of the landscape compared to the number of visually different colors in the region. That was one of the shortcomings that the 1960 and 1976 revisions sought to address.
1931年CIE色度图的一个显著特点,即使从这种粗略的图示中也可以看出,那就是绿色在图中所占的比例远多于该区域中实际存在的不同视觉颜色数量。这也是1960年和1976年修订版试图解决的缺陷之一。
|